Interactive charts
Every chart in stochPathSim is a Plotly Figure. Call .show() in a notebook, .write_html(path) for a
standalone page, or .write_image(path) (with pip install "stochPathSim[export]") for a PNG or SVG.
import stochPathSim as sps
from stochPathSim import viz

viz.set_theme("dark")                       # or "light"
res = sps.Heston(100, 0.03, 0.04, 1.5, 0.04, 0.6, -0.7).simulate(T=1, n_steps=252, n_paths=20_000, seed=1)

viz.paths(res)                              # sample paths, mean, quantile band
viz.fan(res)                                # nested quantile bands
viz.path_explorer(res)                      # choose the state and the number of paths interactively
viz.terminal_distribution(res)              # histogram, optionally with an analytic density
viz.density_evolution(res, kind="surface")  # 3D surface of the density over time
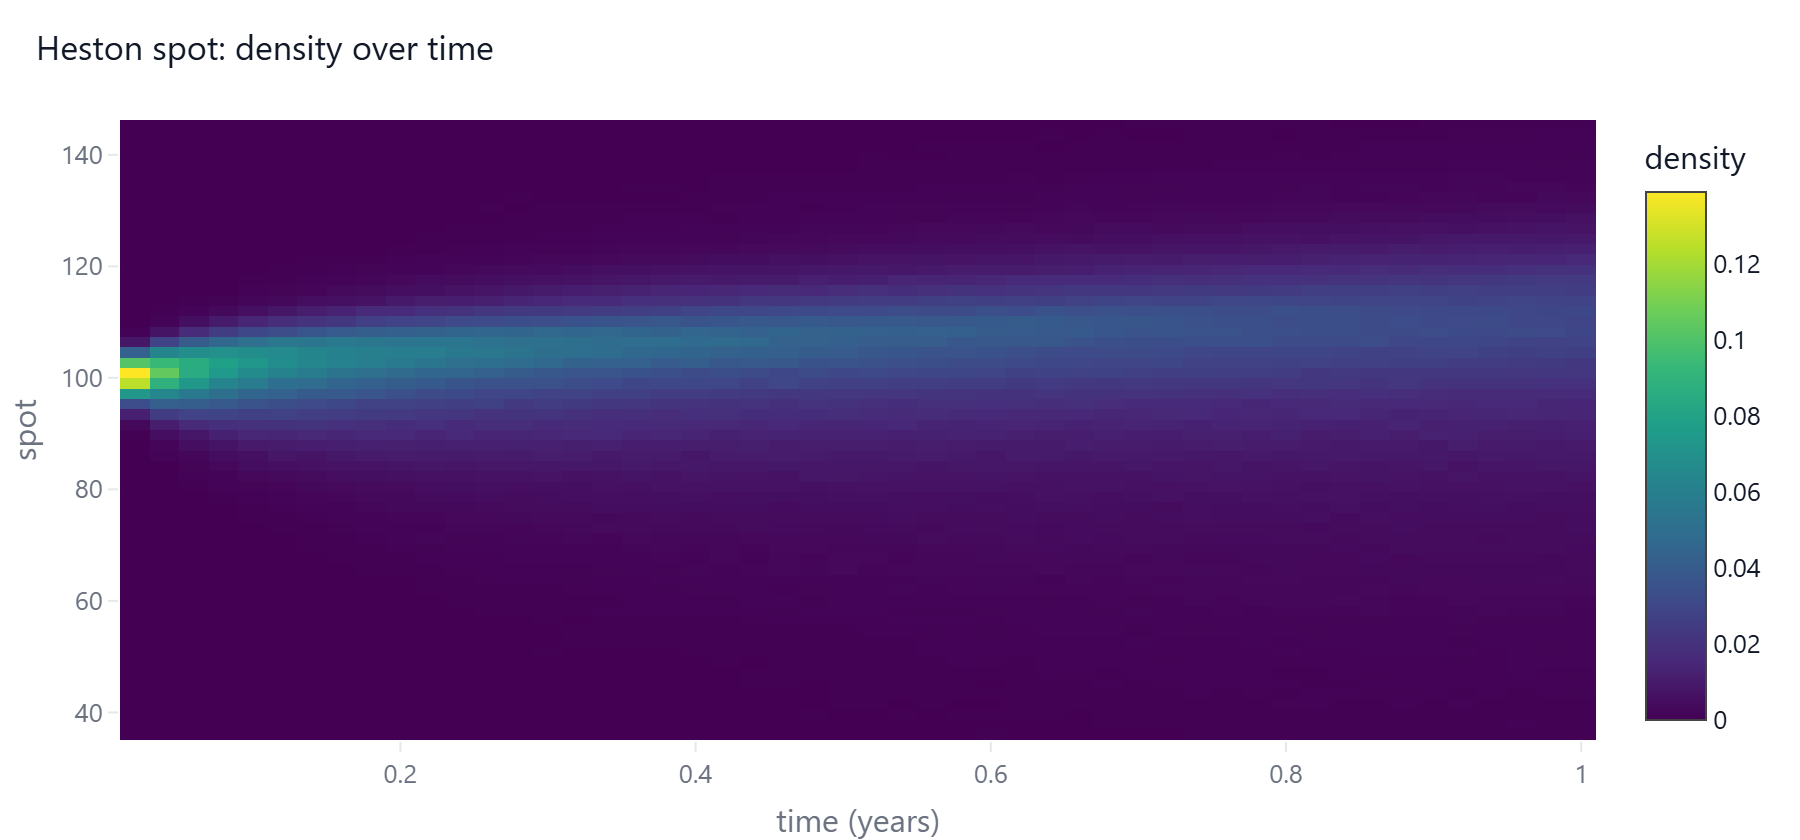
Risk charts take the objects produced by stochPathSim.risk: exposure_dashboard(profile),
backtest_dashboard(pit, ...) and var_plot(pnl).
Normal portfolio component VaR and ES can be displayed with viz.portfolio_risk_chart:
from stochPathSim.risk import normal_portfolio_risk
risk = normal_portfolio_risk([1.0, 0.5], [[0.04, 0.01], [0.01, 0.09]])
viz.portfolio_risk_chart(risk, labels=["Equity", "Rates"]).show()